How to Price an Election
By continuing to read, you agree to the disclaimer at www.aditdayal.wix.com/disclaimer.

The Martingale Approach is the result of a future value is best predicted by the information on the table today. Nassim Taleb just wrote a great paper on putting this approach, which is largely used in quant finance, to pricing elections.
Back in 2016, nobody had really expected Trump to win, and market odds were not pricing it in. This year, those same prediction markets have been closer to 50/50- until recently. It’s actually rumored there is a French millionaire bidding up Trump’s odds and skewing them further than the 50/50 it has been trading at over time.

We took advantage of this spread in my last article buy buying on one broker and selling on another. We were actually much ahead of the curve with Matt Levine of Bloomberg writing nearly the exact same thing the next day. Cool, right?
Anyways- Taleb argues there is a new form of arbitrage using the Martingale approach to price this election arguing that as volatility and uncertainty increases, election odds should not become more certain. This is clear- we are getting more uncertain about who is going to win with polling data becoming tighter and tighter, so why is prediction market pricing becoming more certain?
This leads to mathematical arbitrage. There is a large shift in pricing, and therefore certainty, without any new information. Here’s a simple way to explain it (I am not a math whiz, this is simply my best understanding of what I’m sure has many more layers):
The election odds are priced as options. Either Yes/No events with the pricing determining the probability. Kamala Harris trading at $0.39 means she has a 39% shot at winning this election since it will either settle at $0 (if she loses) or $1 (if she wins).
The Martingale principle states that Kamala should remain at 39% if there is no new information released, as today’s odds are the best prediction of tomorrow’s odds.
It’s intuition that higher uncertainty should bring odds closer to 50/50. But why, mathematically, is that true? Well a logistic function can be used to show how volatility (σ) impacts and scales the certainties of the election. I’m really not one for complex equations that are hard to understand so here’s a picture:

You can see how the initial forecast vs. the one which lets volatility pull it in the respective direction (think of the Y axis as ideal Polymarket pricing) shows how pricing should mathematically be closer to 50/50.
Here’s what to watch in markets:
-Top AI companies are building nuclear energy facilities sending shares flying. Like Sam Altman’s OKLO (which I had talked about when they de-SPACed). I have a stock pick for this at the end of this newsletter :)
-Goldman predicts a 3% annual return for the S&P 500 over the next decade vs. a consensus 6%
-Tuesday is the 13D Monitor Active-Passive Investor Summit (could find some underground stock picks from hedge funds)
-Wednesday is Tesla earnings. Typically moves markets and all EV stocks
Quick Monitor:
-Asia backdrop is getting increasingly more bullish (more China cuts) and plans for $100b injection into Asian market
-US GDP growth is just over 3%, earnings coming in strong, high discretionary spending as well
-Gold hitting highs on Middle East conflict and tight US election
-Bitcoin near ATH with the price likely favoring a Trump win
-Oil drops 7% last week with geopolitical risk premiums falling due to good reports about Iran’s oil assets and weak Chinese demand expected
Charts
ASPI - nuclear small cap looking to continue running with theme

USD- another Trump play as he wants to strengthen the dollar. Overbought as per RSI.

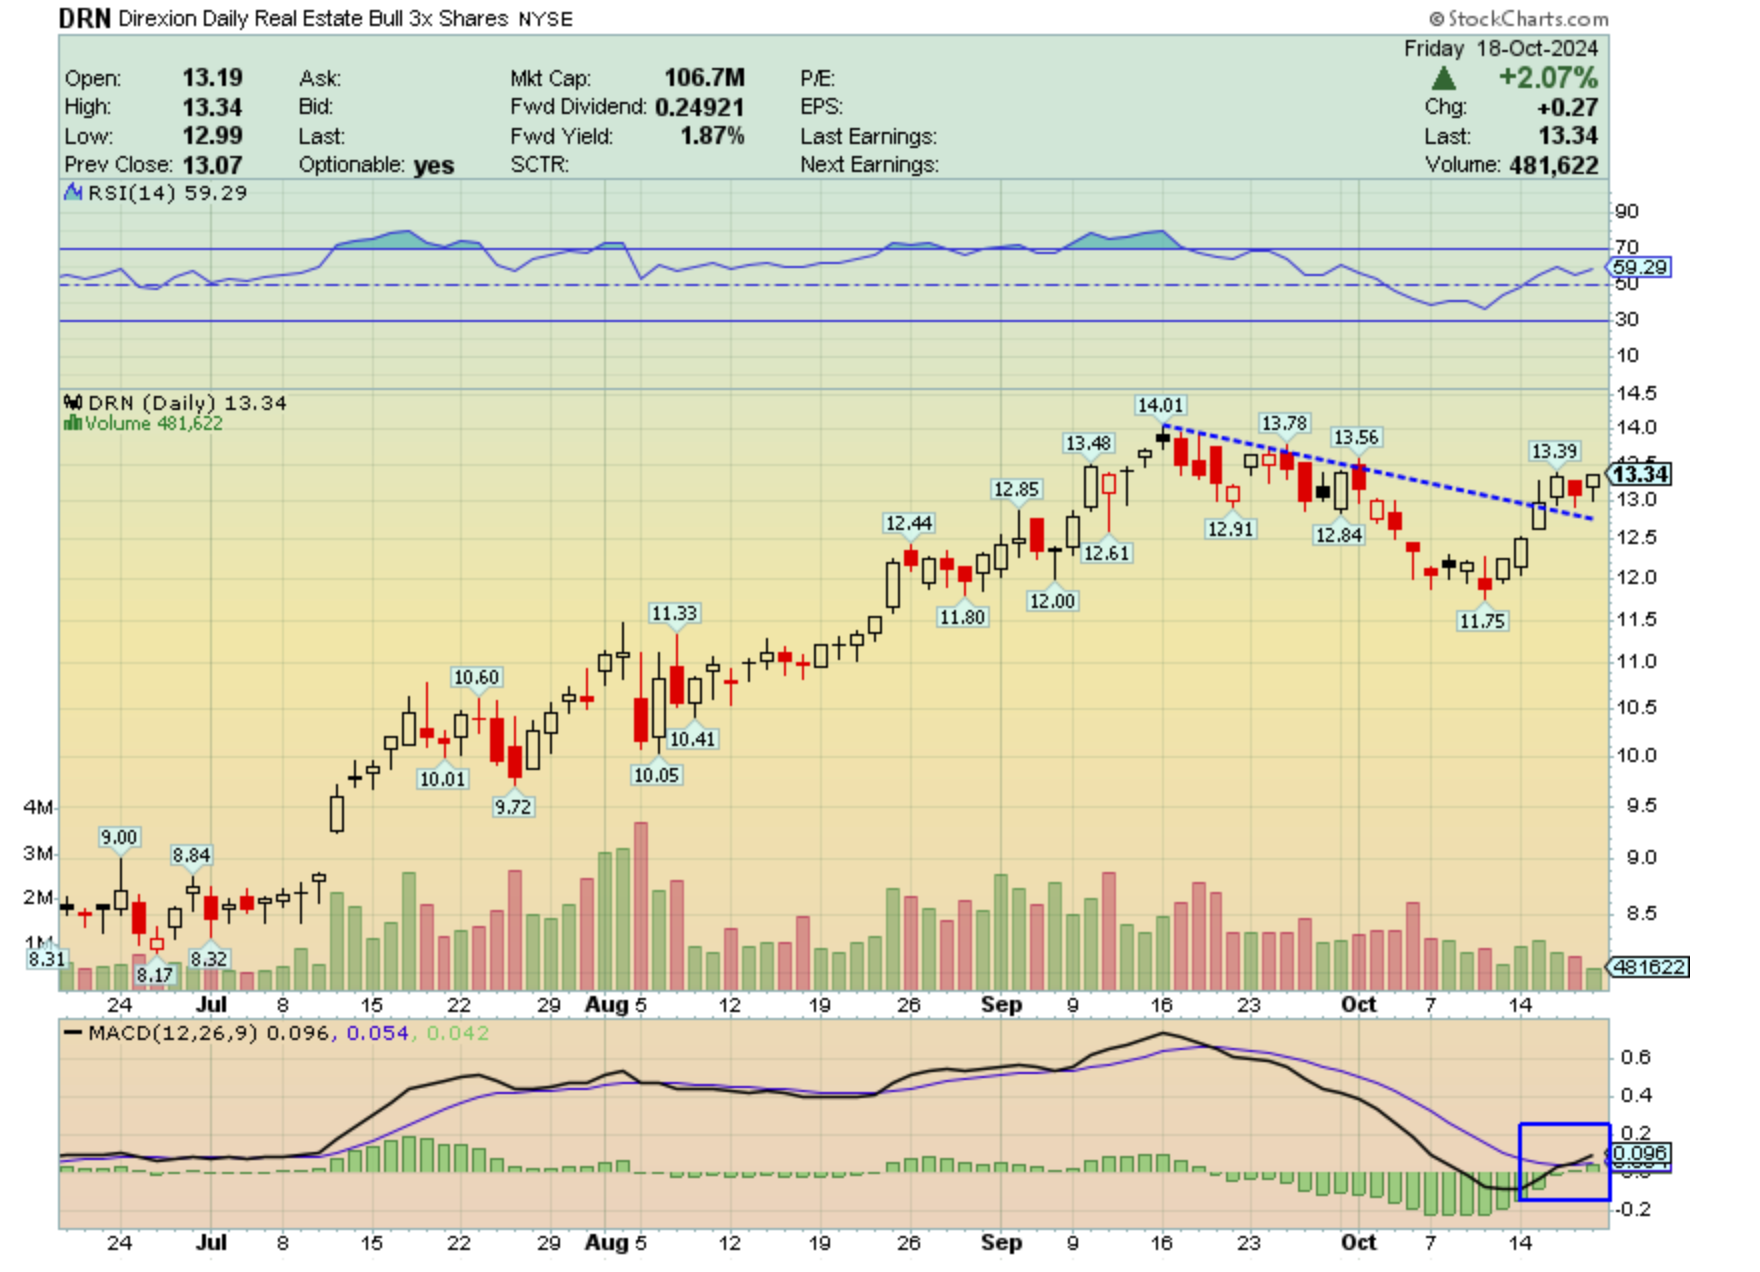
DRN- 3X Real Estate looking bullish in face of rate cuts
SPY- slow grind up. $592.55 is next Fib extension level to watch for a larger pullback

Top Shorted Stocks
CNEY - 76%
RILY- 68%
BBLG - 67%
PLCE - 56%
OKUR - 51%
Have a great week and thanks for reading!
-Adit Dayal